- 2.1 Predicting churn
- 3.1 Five steps to stop customers from leaving
- 6.1 How do you measure customer churn?
- 6.2 What is churn analysis in banking?
- 6.3 What is a bank's average churn rate?
- 6.4 What are the reasons for customer churn in banking?
- 6.5 How does customer churn prediction work in banking?
- 6.6 How can banks deal with the churn problem and prevent it?
Defining customer churn from a banking perspective
In its simplest definition, churn is a measure of how many clients a company loses over a period of time. The process is quite natural, it’s something every business in every industry face. Canceling a Netflix subscription for Hulu, switching from Samsung to Apple, or changing gyms are some everyday examples of churn.
In the banking context, there can be two kinds of churn:
- Customer churn is when customers leave the company entirely. For example, they transfer all deposits to another bank or sign up for a loan but never actually go through with it.
- Product churn indicates clients have stopped using one product or service but may still have other assets with the bank. For instance, they continue using a debit card but don’t work with their investment portfolio anymore.
Identifying what exactly counts as churn, however, is up for debate. Sometimes, customers actively inform the bank they’re discontinuing a service. So once they cancel, you can pinpoint the moment when they’ve churned. But what about abandoning a forever-free debit card? Or not activating a newly issued card? When does this also become churn?
Well, there is no one-fit-all timeframe: you’ll have to decide this for your bank on a case-by-case basis. So while calculating churn requires just two parameters: the number of customers and the time period, you’ll actually need more of them to define it confidently.
Customer churn measurement in banking
The formula for customer churn is as follows:

The churn rate is bound to change over time: there are seasonal highs and lows, some people leave when your fees or terms & conditions change, corporate clients switch projects, etc. Still, you might wonder, is there an industry standard that banks should aim for? Well, financial institutions with binding contracts are said to have attrition rates of 5-7%. The numbers can go up to 25-30% for credit or debit cards.
A single churn rate value won’t get you much insight into what’s happening to your client base. Customer churn measurement in banking should be dynamic and monitored at regular intervals. Only then you’ll be able to tell apart seasonal and long-term trends. It also makes sense to break down the data by location, product, region, client type, or other segmentation parameters.
Say, you have a bank with six branches, and one of them keeps showing a 10% churn rate compared to the average of 5% for the other five. This might indicate a customer service issue at that particular location. It wouldn’t make sense to compare that 10% with the industry average of 25% and do nothing. So always keep your own baseline in mind.
Predicting churn
If your goal is to monitor churn, say, to make financial or analytical reports, its identification and measurement should be enough. However, if you want to be able to intervene and actually retain clients, you will need to predict attrition before it happens. There are two different approaches you could take:
- Estimating the number itself. Suppose you’ve gathered enough data from previous years or have access to references from fellow banking professionals. In that case, this can be done with a simple extrapolation. The presumed churn rate value can come in handy for budget planning.
- Identifying at-risk customers. This can be done with mathematical approximations. A churn prediction model works with customer data: characteristics like credit score, age, tenure, balance, geography, etc. Using a neural network and machine learning methods, it calculates the likelihood of churn for each customer. There are different models out there if you want to dig deeper.
Since models rely on various customer behavior parameters and re-calibrate with new data, the results are quite accurate. However, the formulas need to be customized to fit your bank’s specific churn definition. To run the model and interpret findings, you would also need to train or outsource skilled employees.

If models seem too high-tech, there is a simpler method for customer churn measurement in banking — monitoring NPS over time. NPS, or net promoter score, is a 0-to-10 metric that indicates customer loyalty. It shows how likely a client is to recommend your bank to their friends, family, and colleagues. Customers that name numbers from 7 to 10 probably won’t churn in the near future, but the lower the number gets, the more risk there is.
Both methods can give you a 3–6 months lead time for churn prevention, which is particularly important for B2B clients. Before canceling a bank, most corporate customers usually line up a contract with a different organization to make a seamless transition. However, neither NPS monitoring nor models give you any insights into why a customer’s about to churn.
Customer churn in banking: a prevention strategy
Churn identification and measurement only deal with the aftermath of churn: increasing withdrawals, dormant accounts, low NPS scores, high model-assessed risk, etc. Prediction can buy you some time, but prevention requires addressing churn drivers. Otherwise, it’s a case of treating the symptoms, not the cause.
Customers name ‘poor service’ as the number one reason for leaving their bank. What’s more, 56% of those who churned say the bank could have changed their mind. Note that poor service doesn’t just mean the employees who interact with clients directly. Here are some examples of what would count as a bad customer experience in banking:
- The website is confusing or hard to navigate;
- ATM withdrawals have heavy fees;
- The support hotline is always busy;
- Bank offices are scarce or inconveniently located;
- The mobile app keeps crashing;
- And other cases when customer expectations were not matched.
Of course, other factors like maintenance price, product line, credit conditions, changes in payroll, etc. can make customers churn. While all of them present lines of work for the appropriate departments within your bank, for the sake of this article, we’ll only be talking about customer experience improvements. With outstanding service, clients might be willing to overlook other issues and stay loyal to the bank after all.

Five steps to stop customers from leaving
A prevention strategy should be customer-centric and aim to align your bank’s business goals with the needs, desires, and expectations of your clients.
1. Collect feedback to identify the most pressing issues that are causing churn.
The best way to learn about frustrations or desires customers have is by asking them directly. You can include feedback loops across every channel: call center, web chat, face-to-face consultation, ATM, email, mobile app, social media, or any other medium you use to communicate with customers. You can also conduct dedicated interviews, look at your support logs, study online reviews, and talk to frontline staff.
2. Create segments or personas for customers with high churn risk.
What do customers that are about to churn have in common? Using data from your CRM, model findings, feedback from the previous step, and other available sources, you should be able to make out several distinct groups of clients with similar characteristics. Identify their behavioral patterns, previous experiences, motivations, and frustrations. Consider context — life events such as graduation, house purchase, or relocation.
When your research is complete, you can frame your findings with personas: several descriptive semi-fictional profiles representing particular customer segments. Personas are easier to share across the company than a heavy data set that they’re based on, yet they are just as useful and insightful. Talking about personas evokes empathy towards real customers and their problems.

3. Visualize experiences to uncover problems and see opportunities to solve them.
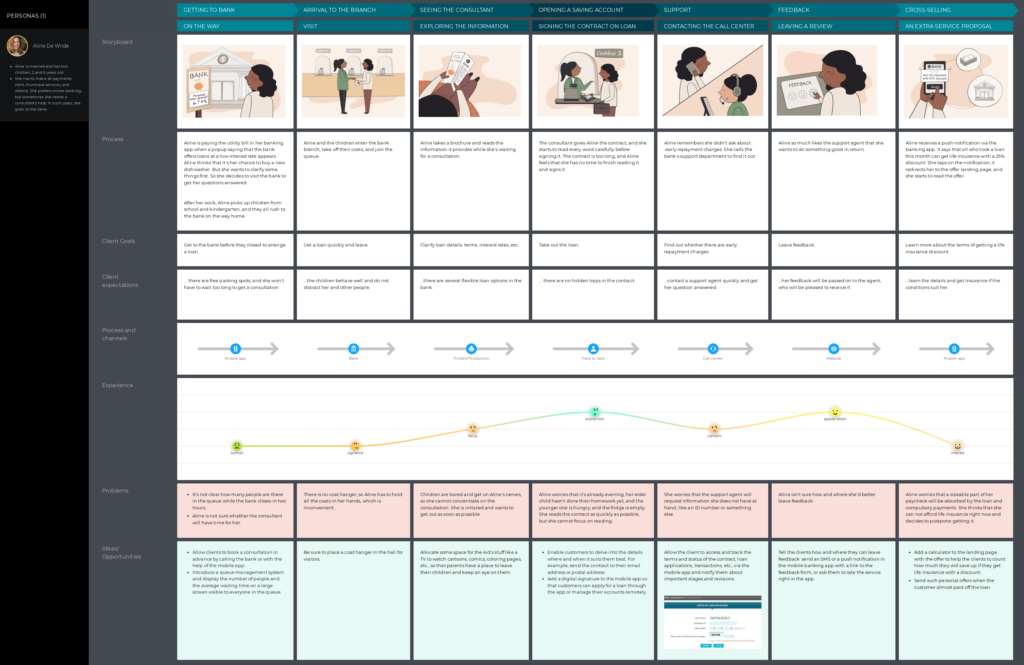
There can be different sequences of events that drive personas towards churn, from first signing a contract or issuing a card all the way to canceling or abandoning the service. Customer journey mapping can give you a comprehensive overview of all interactions between your customers and your bank. This can highlight experience gaps and handoffs clients are lost between departments and devices.
A journey map provides a common ground for starting a discussion about change. Working through the map’s elements, sections, and stages, people can clearly see what flaws fall under their area of responsibility. Customer retention then becomes a shared goal, and the map acts as a place to capture and hold ideas for making the experience better. Finally, a journey map can be used to prioritize improvements and monitor progress.

4. Decide on the action plan and start implementing it.
Once you understand what ignites customer churn, you can start putting out the fires. It makes sense to alleviate the most pressing issues first, which should already lower the attrition rate. But don’t stop there. You can also reinforce the good parts of the experience. It may be as simple as depositing $20 into a newly opened checking account or waiving a late fee for a valued customer.
💡 Idea: If you work with business, it makes sense to use business proposal software to save your time, especially when there are many leads in the pipeline.
5. Track progress and keep adjusting to the changing context.
At this point, all the methods for customer churn measurement in banking that we talked about: models, NPS surveys, and predictions — will be the perfect indicators of whether your improvement efforts are paying off. Customer feedback still stays a valuable source of information, as new issues may arise, and old ones could become irrelevant. Just as churn is not static, neither should your plan be.
Success stories and a shortcut to low churn rates
Even when you know the steps towards churn prevention, the road to success might seem long and winding. That’s where looking at the stories of others might help. For instance, a 2022 research study suggests that prediction models don’t have to be complicated to achieve tangible results. The simplest projection with just 20% of accurate churn prediction could preserve a Brazilian bank approximately R$ 290 million in annual revenue.
Another case study involved a multinational bank with 46 million customers and 200,000 corporate clients. In just six months, they trained machine learning algorithms on three years of historical data like revenue, credit information, and transactions. The model was then able to interpret warning signals and calculate churn risk scores for current customers. The experiment led to a 50% prediction accuracy for churn with up to 90 days of notice, resulting in a $60-$80 million saved profit.
If models and algorithms still seem like too much work for your bank at the moment, you could look into getting these solutions turn-key. An alternative would be to focus on strengthening relationships with your existing customers. Studies show that loyalty programs and incentives like discounts or credit limit extensions can decrease churn rates and make the company stand out among its competitors.
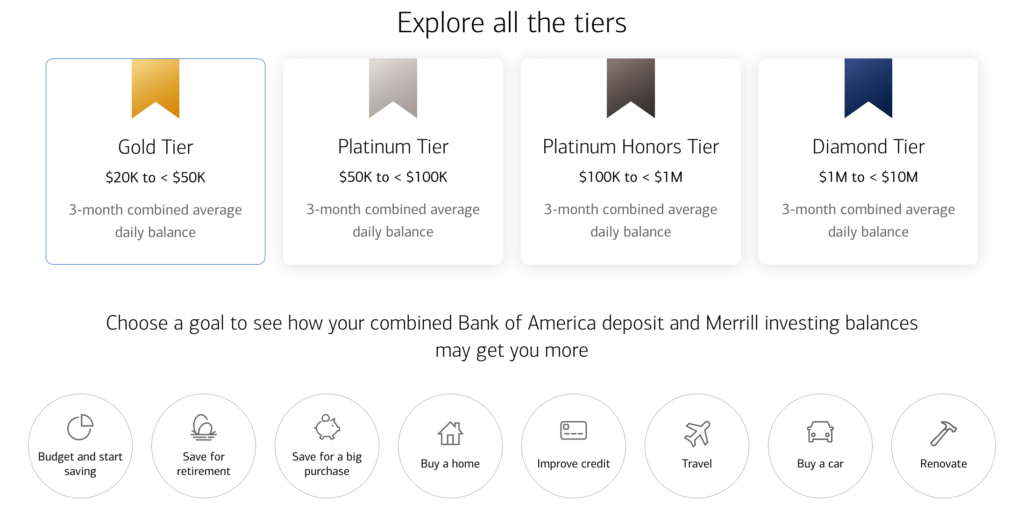
A KPMG study reported that customers expect banks to come up with more innovative ways to reward them in the future. On this note, cash backs seem like a particular win-win. The more money you spend, the more points you end up making, which is obviously great for the bank. For example, Bank of America’s loyalty program even allows clients to choose a personalized goal and work towards it, which is a perfect example of customer centricity.

Final thoughts
Churn can take multiple definitions and forms depending on your bank’s product line and business goals. Accurately recognizing it is only the first step. You then need to measure churn at regular intervals to assess your current state and decide on the right course of action towards a lower rate.
Identifying and predicting churn risk leaves room for maneuver, and gives you a chance to make new decisions on the operational, strategic, and tactical levels. Working on customer experience can play a critical part in your churn prevention strategy. So when you approach customer churn measurement in banking, try to look past the numbers and see the journeys that your clients are actually going through.
If you’re unsure where to start with creating your bank customer journey, look here:
FAQ
How do you measure customer churn?
Customer churn can be measured by dividing the number of customers lost during a particular time period by the total number of customers at the beginning of that period. Basically, the formula shows the percentage of customers who have left the business.
What is churn analysis in banking?
Churn analysis in banking involves analyzing the behavior of customers who have left a bank to identify patterns and reasons for their departure. The findings can then be applied to reduce attrition and improve customer retention in the future.
What is a bank's average churn rate?
The average churn rate for a bank can vary depending on the market and the specific business. However, according to recent studies, it is generally believed that an annual churn rate of less than 5-10% is acceptable for banks. It also makes sense to calculate the churn rate more than once a year, for example, each quarter, to monitor changes.
What are the reasons for customer churn in banking?
There can be various reasons for customer churn in banking, including high fees, a lack of relevant products, low interest rates, inconvenient branch locations, and better offers from competing banks. A high churn rate can also indicate issues in customer service.
How does customer churn prediction work in banking?
Bank customer churn prediction involves using data analytics and machine learning techniques to analyze customer behavior and identify potential churners. Another method would be to monitor company NPS over time. This can help banks take proactive measures to prevent customer attrition and improve customer retention.
How can banks deal with the churn problem and prevent it?
Banks should focus on improving customer experience, providing better products and services, offering competitive rates and fees, and being accessible through digital channels. Additionally, to prevent customer churn for banks, it is important to regularly engage with customers, listen to their feedback, and address their concerns in a timely manner.